Basal temperature during ovulation: we build a graph and analyze the dynamics

The presence of ovulation largely determines female fertility (the ability to reproduce). A woman can become pregnant only for several days during a month, or more precisely, during the period of ovulation, which is why the determination of days favorable for conception is an important task for any woman, regardless of what goals she pursues - to conceive a child or prevent an unwanted pregnancy. . One of the methods for determining ovulation is the method of basal thermometry.
Definition
Physicians and physiologists call the basal temperature the lowest body temperature, which is recorded only during a person's rest period, for example, during sleep. In the state of activity of BT (abbreviated designation of basal temperature) is always increased. Doctors have long noticed that in women, a rise by a few tenths of a degree also occurs during ovulation, and this was the basis of the method for determining fertile days.
The cyclical nature of the female body due to the powerful hormonal support. Thanks to progesterone and estrogen, prolactin and gonadotropic substances produced by the pituitary and hypothalamus, women monthly come monthly, in the middle of the cycle ovulation occurs, which gives women the opportunity to conceive a child. The balance of these hormonal substances and its minor fluctuations do not go unnoticed by the body.
And if a woman cannot objectively feel these changes, then at the level of her basal (base) temperature these processes will certainly be reflected.
The basal temperature indicates the temperature of the internal organs and is true. To fix it, measurements are made in those parts of the body that have communication with abdominal parts of the body, for example, in the rectum, in the mouth, in the vagina.

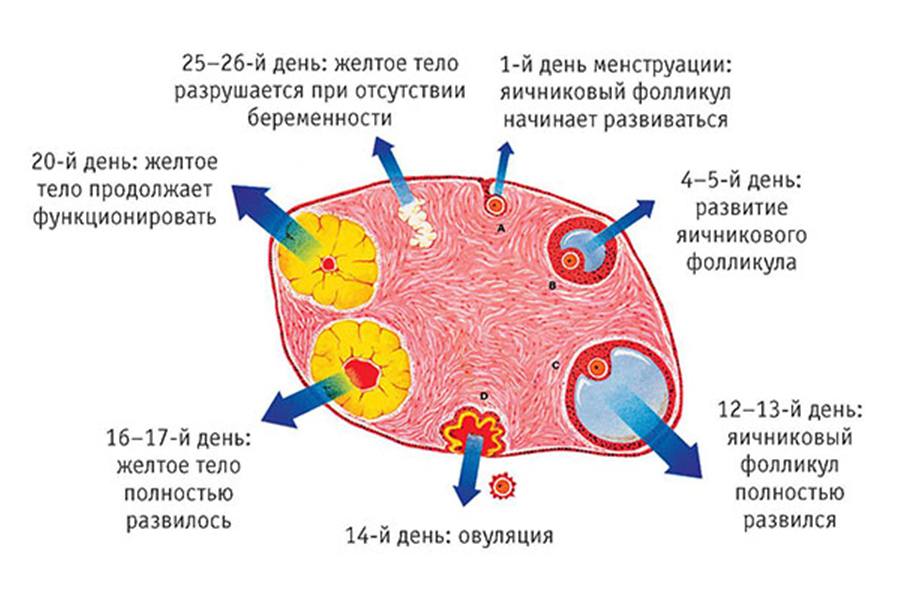
After the next menstruation, estrogen is actively produced in the body right up to the middle of the cycle. It is he who does not allow BT to rise to high values. During normal ovulation, when the oocyte leaves the follicle, and a yellow body forms at the site of maturation of the egg, the ratio of hormonal forces in the body changes - production of progesterone begins, which significantly increases the basal temperature.
Often, the temperature chart of a healthy, capable of conceiving and carrying women is compared to a poetic image - a bird whose wings are wide open, and its beak is the day of ovulation. After ovulation, the temperature remains elevated.
At the end of the cycle, if conception did not occur, the corpus luteum ceases to exist, the level of progesterone decreases, the temperature decreases again, menstruation begins. If the pregnancy has occurred, fertilization has occurred, the temperature does not fall and is kept at high values, since the level of progesterone, an important hormone for carrying a fetus, continues to be high.
Thus, the measurement of BT and a clear understanding of what it should be in one or another period of the female cycle helps a woman to determine ovulation, monitor the state of her female health, and also know (guess) about a possible pregnancy even before it is shown by tests.
Why do I need to define BT?
The opportunity to know the day of your ovulation opens up great opportunities for women. She can calculate the most favorable time for conceiving a child if the couple is planning a pregnancy. Usually one month of daily measurements for this is not enough, you need to conduct basal thermometry 3-4 cycles in a row, only then a woman will get a more detailed picture of the individual characteristics of her cycle.
Further observations of how the temperature rises, will help to track and implantation of the embryo in the uterine wall, and guess possible problemsFor example, the threat of miscarriage in progesterone deficiency.
Also measuring the basal temperature gives a woman the opportunity to plan contraceptive measures correctly, if the conception of a baby is not included in family plans yet. Of course, the temperature method is not a highly accurate and effective method of contraception, but in combination with others (for example, with barrier methods) it gives good results.
Finally, regular basal temperature measurement will allow a woman to pay attention to the pre-menopausal period, the absence of ovulation for a long time, various inflammatory diseases, hormonal dysfunctions, etc., and consult a doctor in time.
In addition, the need to take correct measurements on a daily basis and enter data into schedules disciplines a woman, teaches her to be more attentive to her own reproductive health.
How to measure?
Having dealt with the importance of such an indicator as basal temperature, it is worth explaining that only a correct measurement guarantees accurate results. There are several important rules that will measure BT precisely.
- Take measurements in any one part of the body, do not change the location of the thermometer. If you decide to measure the temperature in the vagina, all measurements are carried out only if you measure the temperature in the rectum, do not carry the thermometer into the vagina. If you want to measure the temperature in the oral cavity, please note that this requires a special thermometer.
- Measure every day at the same time (the permissible error interval is half an hour), immediately after waking up, not getting up from bed, not tossing and turning, since activity can increase the level of BT without reference to female reproductive processes. In the evening, make sure that the thermometer is lying next to the bed so that you can easily reach it with your hand without getting up. From the evening shake the thermometer so that it is fully ready for new use.
- Immerse the thermometer 2-3 cm, no deeper. During the measurement, lie still, do not be nervous, do not talk, do not toss and turn. The total time of thermometry is from 5 minutes.
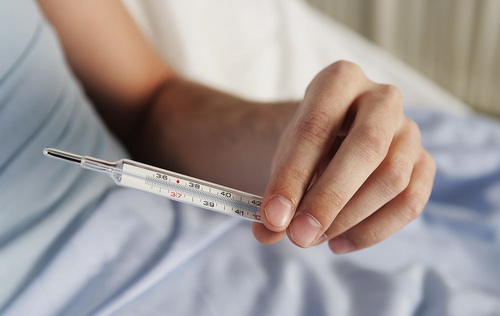
- Thermometer must be of high quality. It is best to choose a mercury thermometer, it is more accurate.
- The first time you need to measure the temperature on the first day of the next menstruation and then daily, without taking breaks for menstruation.
- The best time to measure is 5-7 am. If you are used to sleeping before dinner, wake up at this time, take measurements and go to bed again.

Important! To ensure that the measurement results are accurate and the graph is correct, watch the amount of sleep before the measurement. For an adequate result, it is important to sleep at least 6 hours before measuring continuously, without getting up to the toilet.
remember, that the accuracy of the results may suffer from the travels of a woman, change of climatic and time zones, physical exertion, severe stress. Also affect the result may sexual intercourse, held on the eve of measurement. If a woman is suddenly ill, she has a high body temperature, then it is better to leave measurements until the next cycle, since about 10 days after her recovery, the results of BT will not be objective.
Every day, add the measurement result to one tenth of the graph. Only at the end of the cycle can you start decoding it, Do not try to analyze intermediate results and draw any conclusions - for this you need more information.

How to make up correctly?
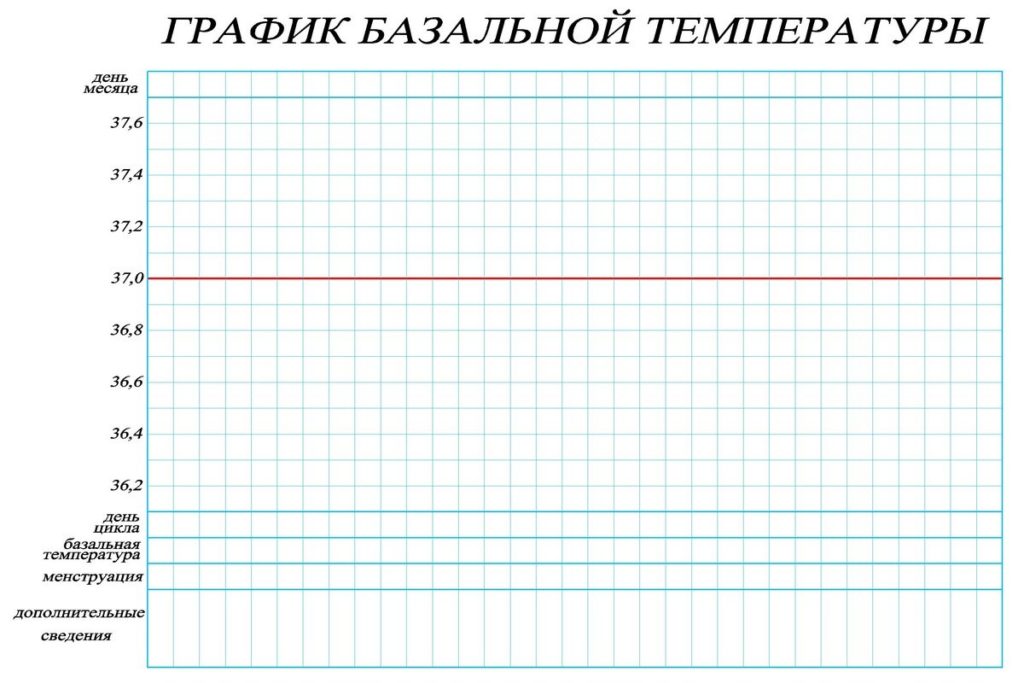
To compile a schedule, it is not at all necessary to get some special forms, you can use the most common tetrad sheet in the cage. It is necessary to draw two lines on it, as it was done at school in mathematics lessons - the abscissa axis (horizontal) and the ordinate axis (vertical). On the horizontal line you will mark the days of the menstrual cycle (you can by dates, you can by DMC - the day of the menstrual cycle, but you can and so at the same time). On the vertical line make the markup, like on a thermometer - from 36.0 degrees to 38.5 degrees, not forgetting about tenths (36.1, 36.2, 36.3, 36.4, 36.5, 36.6 , 36.7 and further to 38.5).
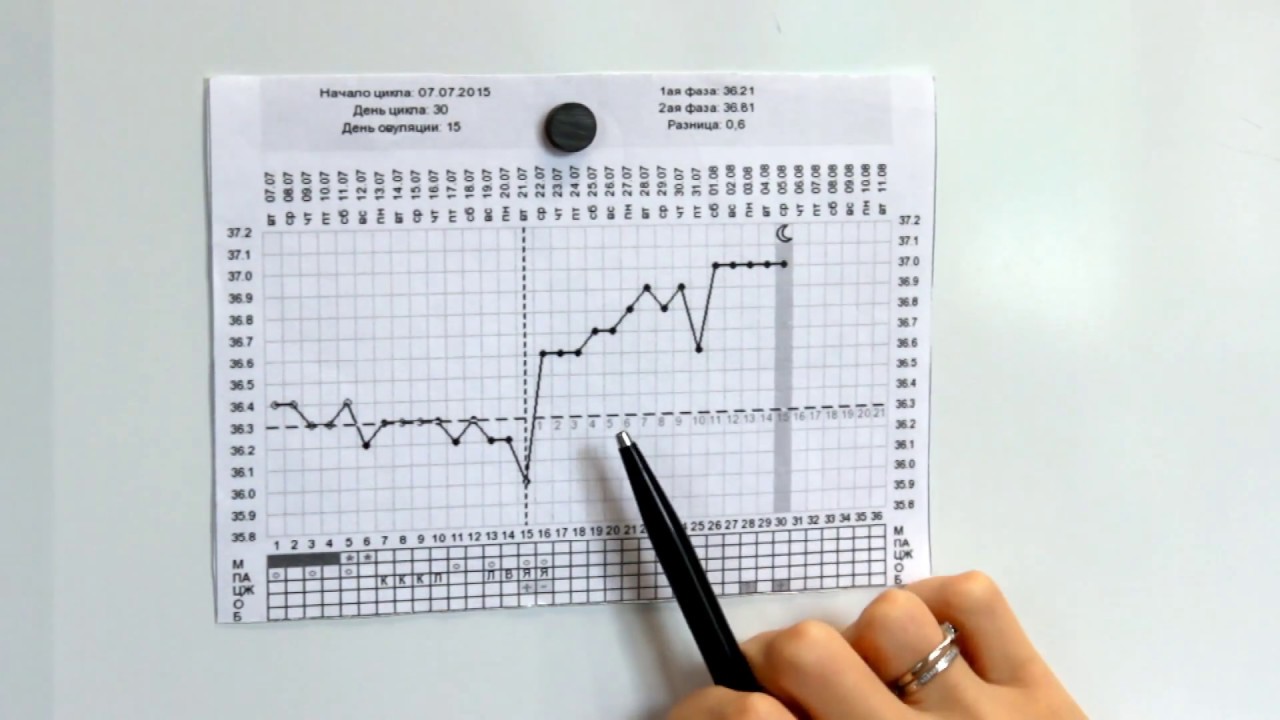
In the morning, after the measurement, put a dot at the intersection of the day and the temperature obtained during the measurement. Gradually connect adjacent points in series. At the top of the graph, you can leave space for your explanations. If, for example, there was sex on the eve of the measurement or you took alcohol, note this fact in the chart over the day on which you are measuring.
You can not lay out a piece of paper in the box, and use the ready-made forms for maintaining the BT-graphs, you can print templates from the Internet.
You can keep a schedule in the online mode, many women's sites offer interactive services for maintaining basal temperature graphs. If you choose this way, you will still duplicate the figures on paper, this will help the doctor in deciphering if you need to consult a gynecologist or a reproductive specialist.
Analyzing the results
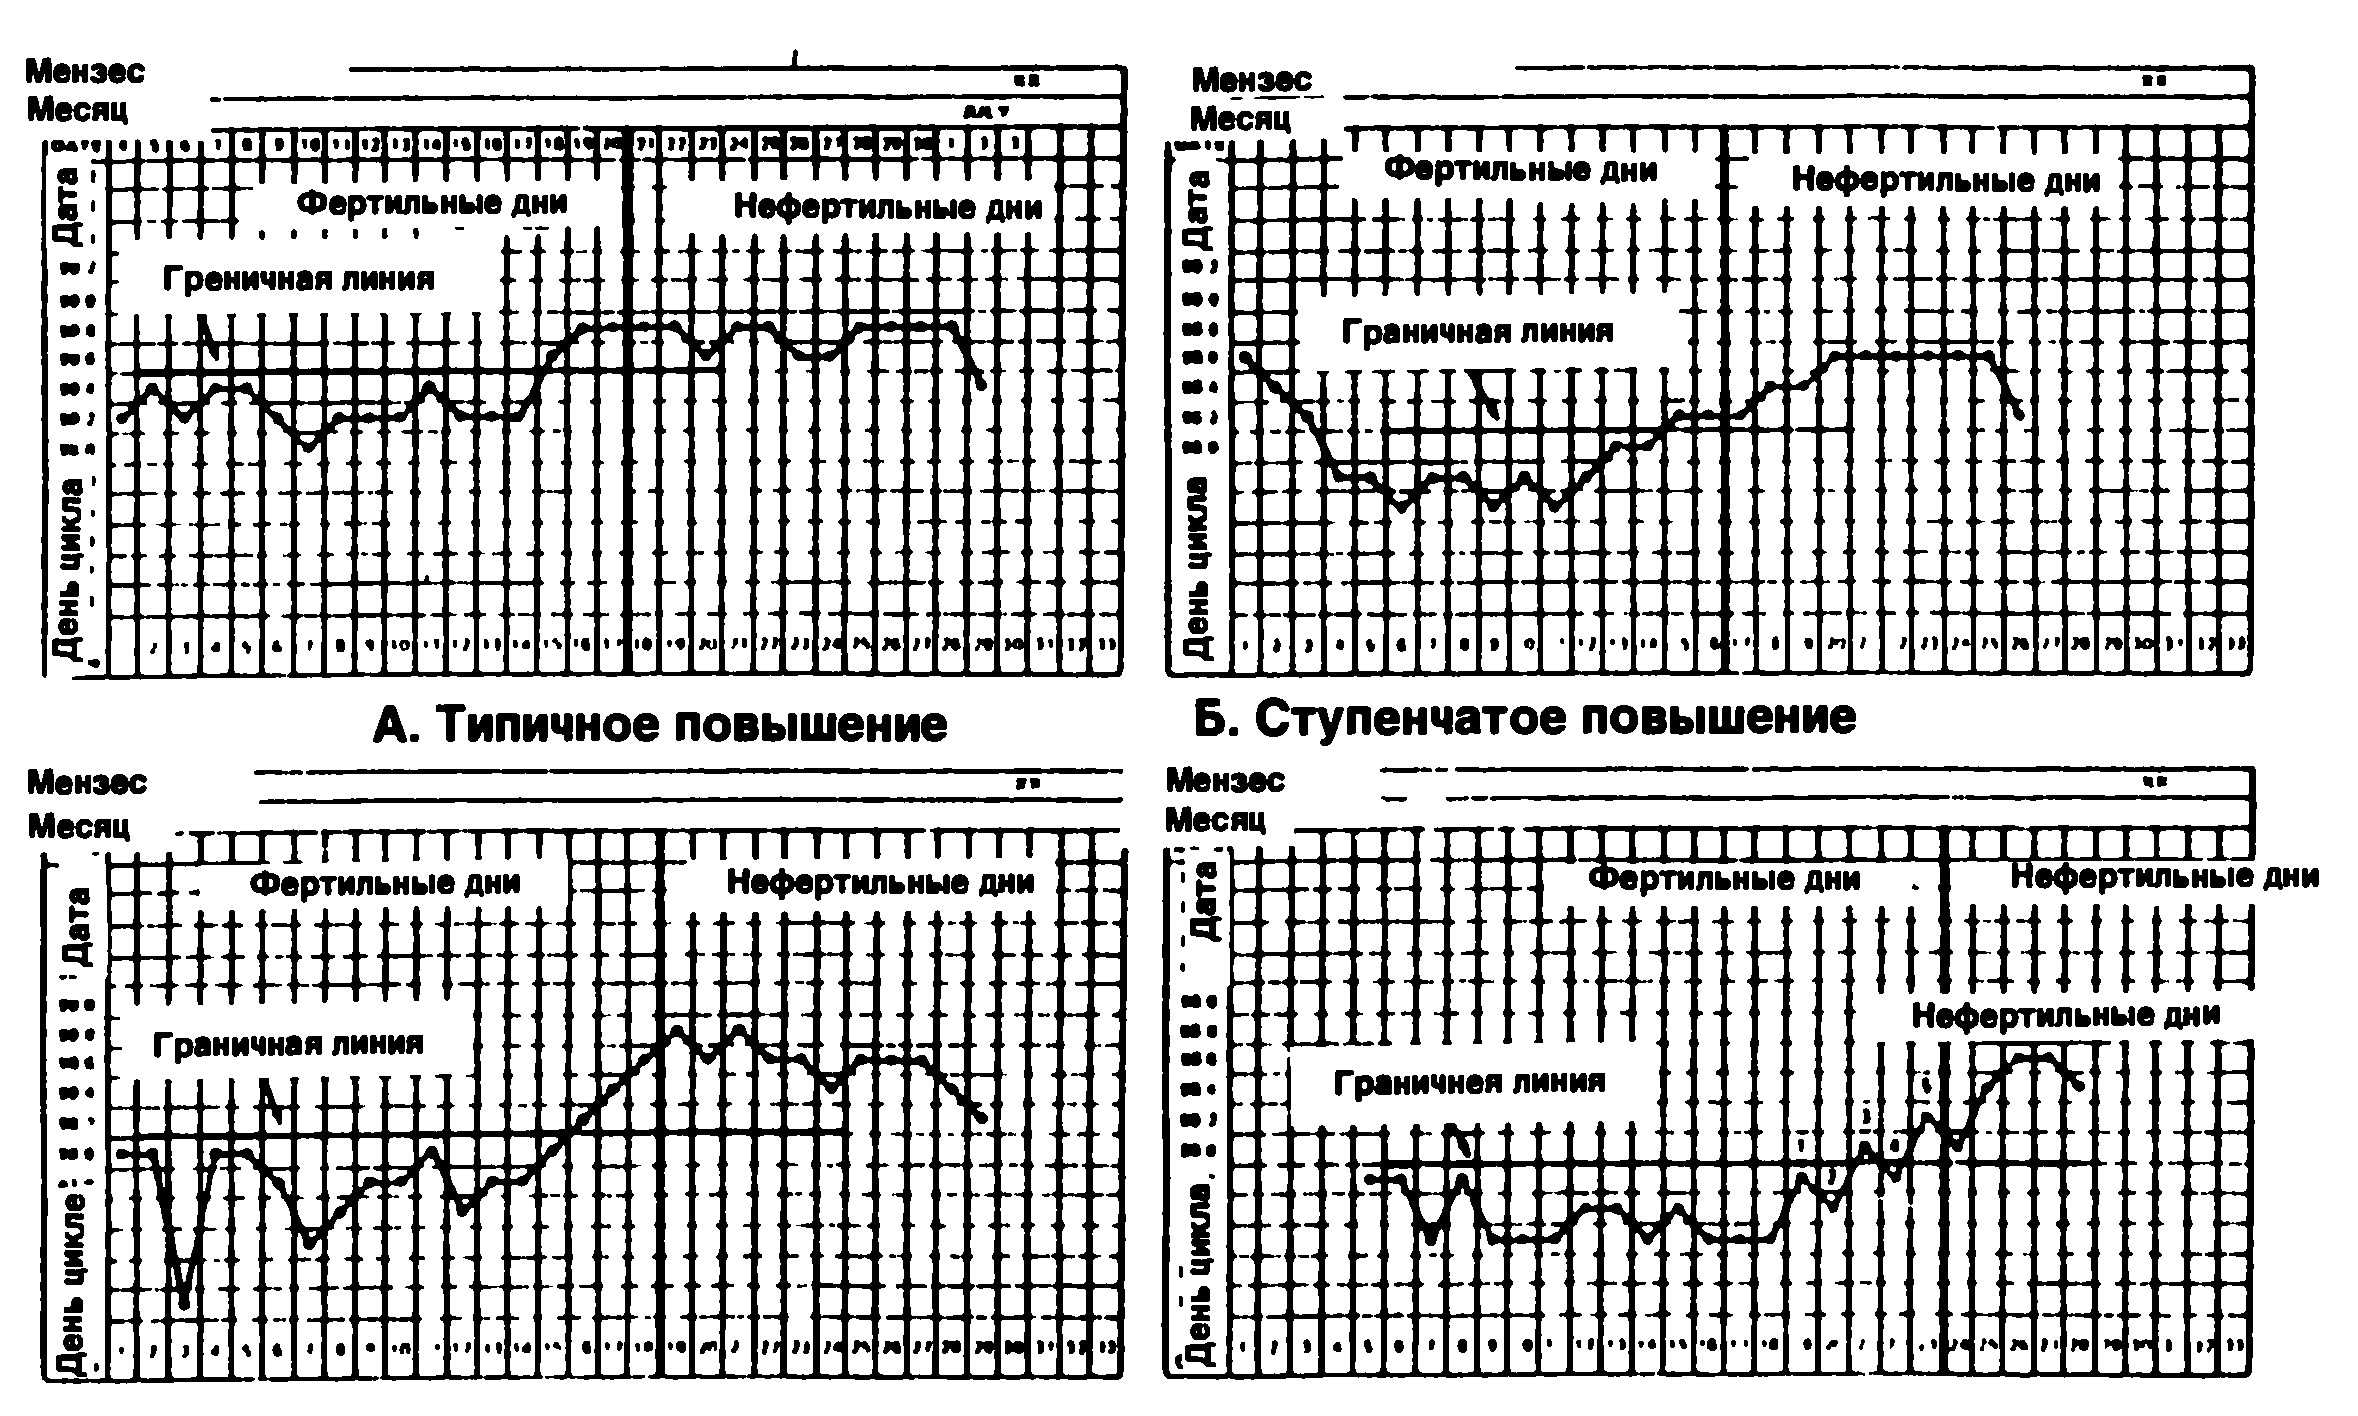
Before proceeding to the explanations of those or other resulting graphs, It should be noted that there are several temperature curves that a woman can get.
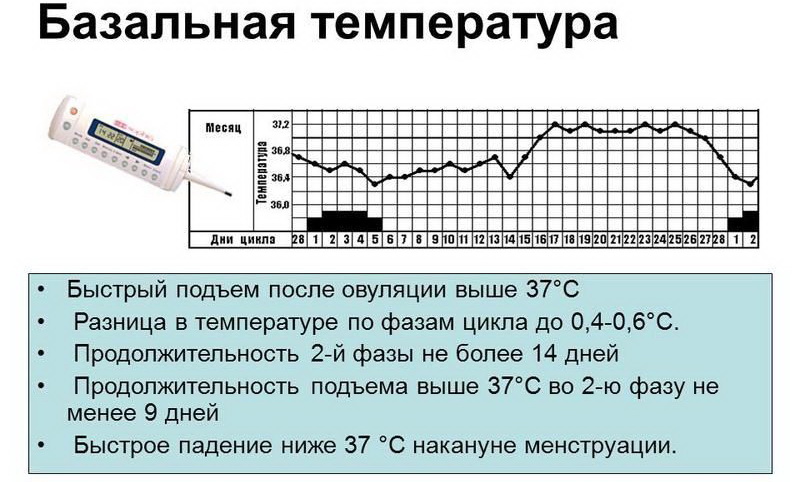
- First type curve - in the second phase of the menstrual cycle, the temperature increased by no more than 0.4 degrees. Before ovulation, there was a decrease in temperature, a similar decrease was noted before menstruation. The period of elevated temperature lasted from 12 to 14 days. This is a normal schedule, saying that ovulation was, she was normal, there are no hormonal disorders, a woman may well become a mother.
- Curve of the second type - in the second half of the menstrual cycle there was an increase in temperature, but it was less pronounced (did not exceed 0.2-0.3 degrees). Such a woman has a certain hormonal deficiency associated with a deficiency of estrogen and progesterone.
- Third type curve - the second half of the cycle lasts less than 10 days, after which menstruation occurs. The temperature rises only shortly before menstruation and there is no recession before a menstrual bleeding typical of healthy women. Such a schedule is a reason to visit a doctor and find out the reasons why the second phase is considered insufficient.
- The fourth type curve is monotonous. (significant changes throughout the female cycle does not occur at all). Such a schedule suggests that there was no ovulation, the cycle was anovulatory.
- Fifth type curve - a chaotic chart with large swings, rises and falls in BT. The graph is difficult to attribute to types 1,2,3 and 4, it is unlike any of them. There are several options - either the woman took the temperature incorrectly, or she had a severe hormonal imbalance, or additional factors influenced her. It is necessary to make other measurements and visit the doctor.
Some situations should be analyzed in more detail with explanations.
Norm with full cycle
The first three days of the menstrual cycle a woman holds a temperature of about 37.0 degrees. This is normal, because there is a process of rejection of the endometrium, on the 5-6th day of the cycle, when the menstrual period ends, the temperature drops to 36.4-36.7 degrees.
The longer the cycle, the longer the period of low temperature of the first phase. With a 28-day cycle, the phase can last a week, and with a 32-day cycle, 1.5 weeks and a half. All this time, BT is at 36.4-36.6 (rarely up to 36.8 degrees). You do not have to worry about the fact that it is different every day: minor fluctuations are the norm.
2 days before ovulation, the temperature decreases by 0.1-0.2 degrees, the day before ovulation, the reduction amounts to 0.6 degrees, and therefore a sharp rise in BT begins. At the time of release of the egg temperature can be from 36.7 to 37.0 degrees.
If conception has come, then after ovulation the temperature remains high or gradually slowly rises, increases. Approximately in a week, implantation falling is observed, the temperature drops on the day, and then increases again. Often women describe this phenomenon, according to reviews, as an ovulation rise of BT with a return.

If there is no pregnancy, BT decreases gradually.
What does high temperature mean in the first phase?
If already in the first days after the completed menstruation, such values as 37.0, 37.2 and more appear on the chart, it should be understood that The level of estrogen in the body is not enough, in connection with which BT increases. As a rule, such a beginning of a cycle does not promise its successful completion, and in most cases it is a classic example of a graph in the absence of ovulation.
The second phase of such a cycle is visually not very different from the first, and rather sharp temperature drops are possible in it. There is no question of any smoothness or gradual increase in speech. Conception in such a cycle is either impossible or extremely unlikely. A woman may feel hot flashes, headaches, arrhythmia, excessive sweating.
Be sure to visit the doctor and start receiving hormonal treatment.

After ovulation, the temperature does not rise
No temperature rise after ovulation is complete, says about deficiency in the body of progesterone. For this reason, hormonal infertility often develops, as well as chronic miscarriage, since a small amount of progesterone does not guarantee the safety of the embryo. A decrease in temperature in the second phase of the female cycle (from 2 to 10 days after ovulation, while BT decreases significantly) indicates the poor functioning of the corpus luteum.
No ovulation
Unfortunately, the older a woman becomes, the more often she will make such graphs, on which there is no decline in BT, which is characteristic of ovulation, and there is no growth after the expected day of the release of the egg from the follicle. Ovarian reserve is depleted, and this is the cause of the age-related decline in female fertility. In cycles without ovulation, a woman cannot become pregnant.

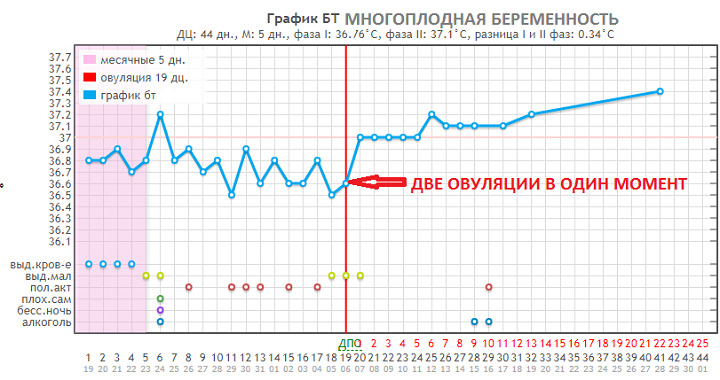
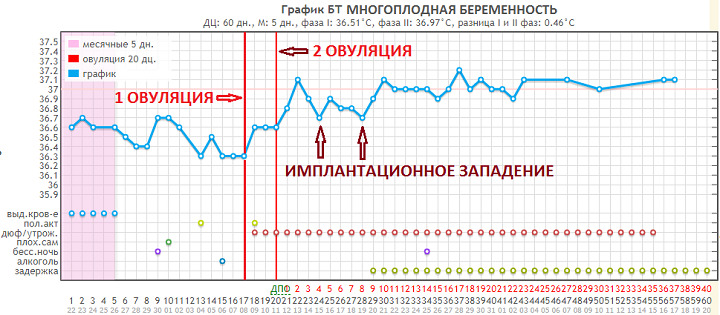
Double ovulation
This is a very interesting phenomenon that happens less frequently. When it matures, not one, but two eggs, and one goes before the other. With double ovulation on the chart will be observed two ovulatory "beak" and two subsequent rise. At the same time, on the graph with two ovulations, the first one looks more brightly than the second one, which proceeds against the background of elevated progesterone.
But note that spontaneous ups on the chart can speak not only about ovulation or pregnancy, but also about the beginning of the inflammatory process in the female body.
Can graphics be wrong?
The temperature method for both those planning pregnancy and those who would like to avoid it is recommended as an auxiliary, rather than the main one, since errors in measuring BT can be significant. With early ovulation or late ovulation, the limits of the fertile window are shifted, therefore, it is possible that it will be difficult to conceive a crumb or, on the contrary, a woman will become pregnant unplanned.
For pregnancy planning It is recommended to combine the method of basal thermometry with the cervical symptomatic method, with conducting tests for ovulation. If the main task is contraception, the systematic use of contraceptives is recommended without reference to the basal temperature or condition of the cervix on a given day of the menstrual cycle.
Important! If you are taking oral hormonal contraceptives, it is not necessary to measure BT because the results will not be reliable - the drugs suppress ovulation, it does not occur, therefore all schedules will be anovulatory.
If you suspect a hormonal disturbance according to the “dancing” schedule of BT or too even schedule without ups and downs, then take into account that The exact reason will be determined only by a doctor who will prescribe blood tests for the hormonal profile, ultrasound of the pelvic organs, and in some cases ovarian fluorography.
About the basal temperature during ovulation, see the following video.